Her you will find the pbix file and here the Excel file that contains the sample data
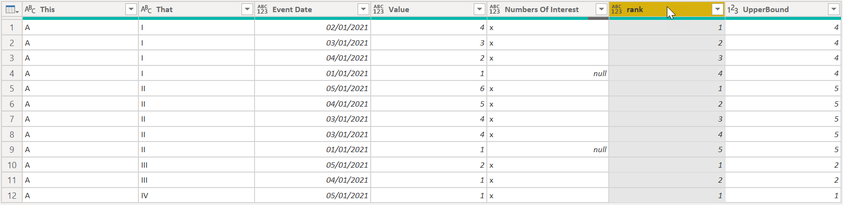
The other day I was facing an interesting question "How can I randomly draw ten records from the top 50 for each group using Power Query?" For better illustration meaning better readability, I will reduce the number of draws to 2 and the number that determines the sample inside a group to 3 (the top 3 values). The following picture shows some sample data 😊. Be aware that the column "Numbers of interest" is not part of the data. I use it to explain what I'm looking for.
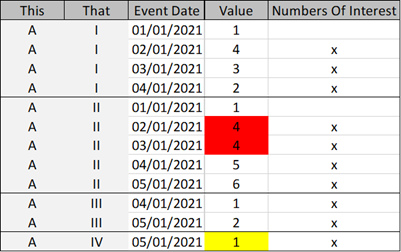
In the above picture, the columns This and That mark a group.
Group a | I is the most simple group. There is nothing special about this group. Four rows are forming the group. The rows containing the values 4, 3, and 2 are the rows of interest, the Top 3 rows inside this group. From now on, I call these rows the stack. The row containing the value 1 (Event Date: 2021-01-01) is inside the group but not inside the stack.
Group A | II is notable, as four rows meet the criteria: Top 3 values. If you are familiar with ranking, you are familiar with this kind of problem: ties.
In Group A | III, the number of rows matches the number of draws. This does not mark another condition, it emphasizes the need for efficiency. All available rows have to be selected if the number of available rows is less or equal to the draws.
Group A | IV is a minor variation of the previous group as the number of rows inside this group is less than the number of draws. This means that this one row must appear in the random draw.
Early Considerations
Until now, I did not use Power Query / M for data sampling. For this reason, I tried to prepare myself for the challenge ahead and created simple statements that describe what an algorithm/function has to accomplish. Here are the statements:
· Randomly draw a given number of rows from a given set of rows (the stack)
o A parameter determines the maximum number of draws (adding flexibility)
o The number of draws is automatically reduced to the number of rows of the stack if the number of rows inside the stack is less or equal to the number of draws
· A group can contain more rows than a stack. In the above sample data, this is reflected by the groups A | I and A | II.
· The number of groups is not known and is dynamic
· After each draw, the selected row has to be removed from the stack to avoid a redraw
Group A | II requires additional thinking about treating a tie, e.g., expanding the number of rows inside the stack and if the random drawing will be affected if duplicates (rows with the same value) are inside the stack. This article by Ken Puls explains how ties can be handled with Power Query: Ranking Method Choices in Power Query
Here I neglect the problem of ties. I choose three records (the ordinal rank). I will likely expand this example in the future.
The solution
Whenever I said "draw a row" in the previous chapters, I did not think about a row literally. I do not want to handle a row, e.g., write the "lucky" row to a new table and remove the row from the source row, as I consider this approach bulky and error-prone. I want to tie a number to each row of a group. Of course, this number has to reflect the rank as I'm looking for the Top N rows/numbers. The range of available numbers is identical for all groups 1..3, except for the groups where the number of rows is less or equal to the number of draws.
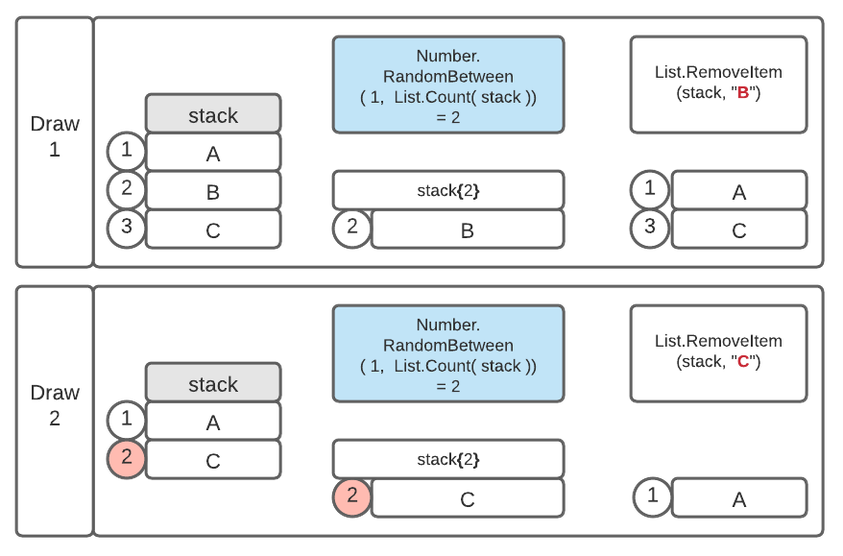
Avoiding a redraw also means that the stack has to shrink with each draw. This also means that I can't draw from the numbers directly, but instead, I draw a random number from a range of numbers reflecting the size of the stack, shrinking with each draw. Then I use the random number to look up the item from the stack. At a later stage, the draws filter the rows of each group. The following picture shows what I'm talking about:
If you are familiar with programming, then you are aware that the drawing is an iteration. Unfortunately, there is no control structure like FOR/NEXT or DO/WHILE available in Power Query. Not to mention that variables are immutable, meaning that implementing an iteration like the one below
for ($iter = 0 ; $iter -le $NoOfRequestIds_Int -1 ; $iter++) {
…
}
is not that obvious using Power Query/M, in contrast to PowerShell (the snippet above).
If you are not familiar with loops inside Power Query/M, I recommend this mini-series about loops written by Uwe Mester | LinkedIn that starts here: Start of series: Programming loops with M-language in Power Query - data-insights.de: Microsoft Self-Service BI für den Mittelstand
After reading the three articles, it is also good to watch this video by Ben Gribaudo | LinkedIn. This video introduces fundamental concepts of Power Query/M: (2) How PowerQuery Thinks - Ben Gribaudo - August 20, 2020 - YouTube In this video, Ben introduces concepts like immutability. Still, even more important Ben is also explaining the record object.
I use the List.Generate function to overcome the missing DO/WHILE control structure and the record data structure to overcome the immutability of variables.
Two parts are forming the solution
·
The ranking
The ranking provides an ordered list inside a group. This list is the stack.
·
The random draw
I'm using a custom function to create a list that reflects the random drawing. This list filters the table based on the ranking inside each group.
The ranking
I'm using a "trick" to create an ordinal rank inside a group for quite some time. For this, I first group the table, then I inject some M code, and finally, I expand the table to new rows – done 😊 I explained this technique in this article in more detail: Navigating Tabular Tables - Previous Row - Mincing Data - Gain Insight from Data (minceddata.info)
In addition to the grouping operation "All rows," I use Count as a 2nd aggregation function. Count will return the number of rows inside a group. This number helps avoid errors during the drawing, e.g. when the number of rows inside a group is less than the number of intended drawings and represents the upper bound of the stack. The upper bound may vary from the number of rows if a different ranking algorithm is used than the ordinal ranking.
The picture below shows the configuration of the grouping dialog:
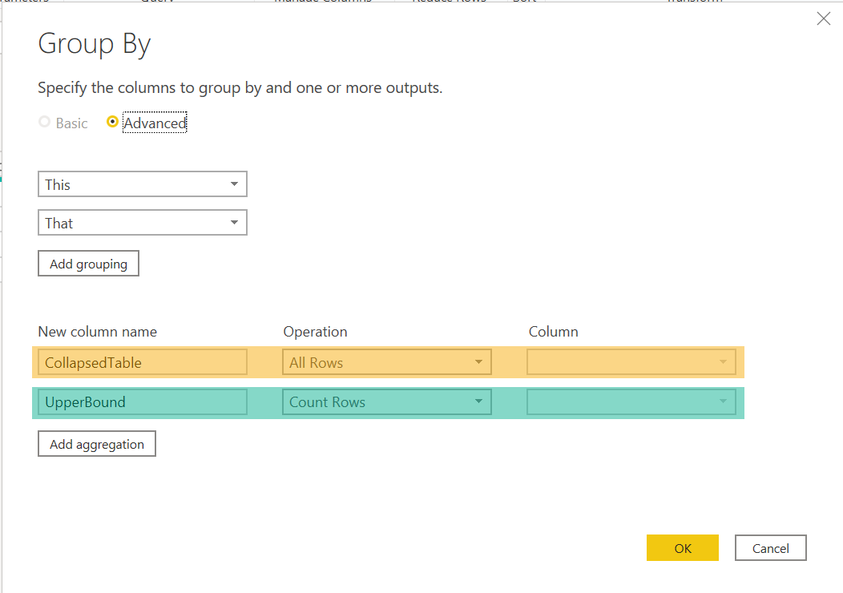
The orange aggregation collapses all rows inside a group but keeps the rows. Using the operation "All Rows" collapses all rows and columns (even the columns used for the grouping) into a table object.
The green operation returns the number of rows inside a group.
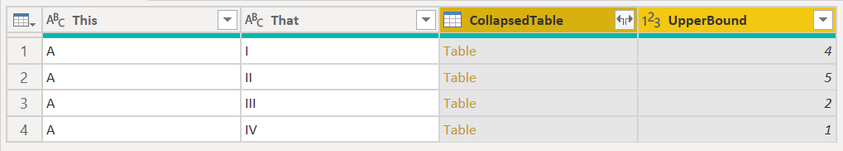
The picture below shows the result of the grouping.
The code snippet below shows the Table.Group command added to the query before the application of the "trick," be aware that the code might look different as I have added comments and formatted the code:
#"Grouped Rows" =
Table.Group(#"Changed Type", {"This", "That"},
//grouping operations
{
// All rows aggregation
{"CollapsedTable",
// the underscore in the next line will be replaced by some M functions creating the ranking
each _,
type table
//i commented out the explicit reference to the columns
// [
// This=nullable text,
// That=nullable text,
// Event Date=nullable date,
// Value=nullable number,
// Numbers Of Interest=nullable text
// ]
},
//Count aggregation - this column will be used to determine the upper bound of the stack
{"UpperBound", each Table.RowCount(_), Int64.Type}})
The next snippet shows the code that replaces the line each _ injecting the functions to create the ordinal ranking.
each
Table.AddIndexColumn(
Table.Sort(_ , {{"Value" , Order.Descending}})
, "rank"
, 1
, 1
)
Please be aware that it's no longer possible to open the Group by dialog after the tweaking, as the dialog can not render the M functions.
The query "sampledata - just the grouping" contains just the grouping. It does not include the custom function application and does not contain the table expansion.
The following picture shows the expanded table:
Please be aware that the custom function has to be applied before the table expansion.
The random draw
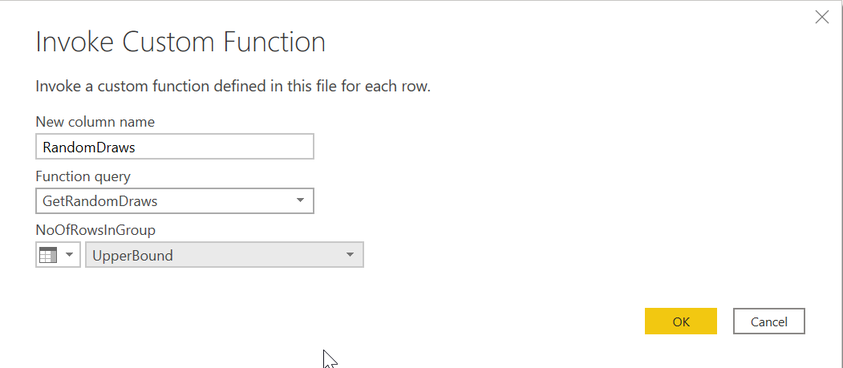
I use a custom function to implement the random drawing with a single dynamic parameter. The operation
Add column à Invoke Custom Function
applies the function.
Be aware that the function has to be applied before the table is expanded.
The following picture shows the configuration of the function:
The following picture shows the result:
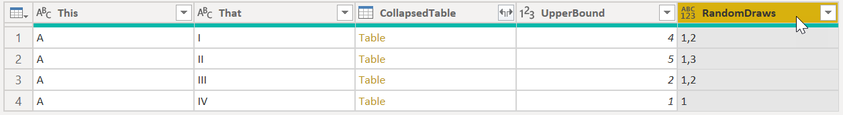
If you wonder why the column contains a string and not a list as you may have expected. The answer is not that simple:
It's because of the non-deterministic M-function Number.RandomBetween. Converting the list into a comma-separated string prevents the re-evaluation of the function during the table expansion.
I tried to comment as much as possible inside the function. For this reason, I skip the explanation here.
final steps
Now, it becomes necessary to filter the rows down to the requirement two random rows from the Top N. For this reason, I expand the table and add another column, "Check." This column contains the value TRUE if the value of the column rank (The Top N values) is inside the "list" of the random draws. For this check, I transform the string into a list and use List.Contains. This is to avoid simple errors that may occur due to simple text comparison.
The snippet below shows the functions used to calculate the column.
List.Contains(
Text.Split(
[RandomDraws]
, ","
)
,Text.From( [rank] )
)
Finally, the value TRUE helps filter down the table, you may also consider removing all the columns that are no longer needed.
A final word
Even if the initial requirement was raised due to some auditing requirements, I already used this approach to sample data, for some DAX writing, as the dataset becomes more compact and also allows to create some unexpected results due to some random data distribution 😊
Thanks for reading,
Tom
Kommentar schreiben